Just The Facts, Ma’am

That’s what this blog post is about: just the facts of what I observed and experienced during today’s rowing workout. The verdict is anybody’s guess, though I do offer my opinion/theory.

Blog posts have become less frequent and at the start of today I once again wasn’t intending to write one but today’s heart rate behavior was strange enough that I decided to say a little about it and also mention my vague theory as to why two heart monitors were in such radical disagreement.

For today’s rowing session I wore two heart monitors. One was a Garmin chest strap which detects periodic electric pulses from the heart. The other was a Scosche armband which uses lights instead of an electric pulse detector and which detects periodic variations in reflected light for pulse measurements.

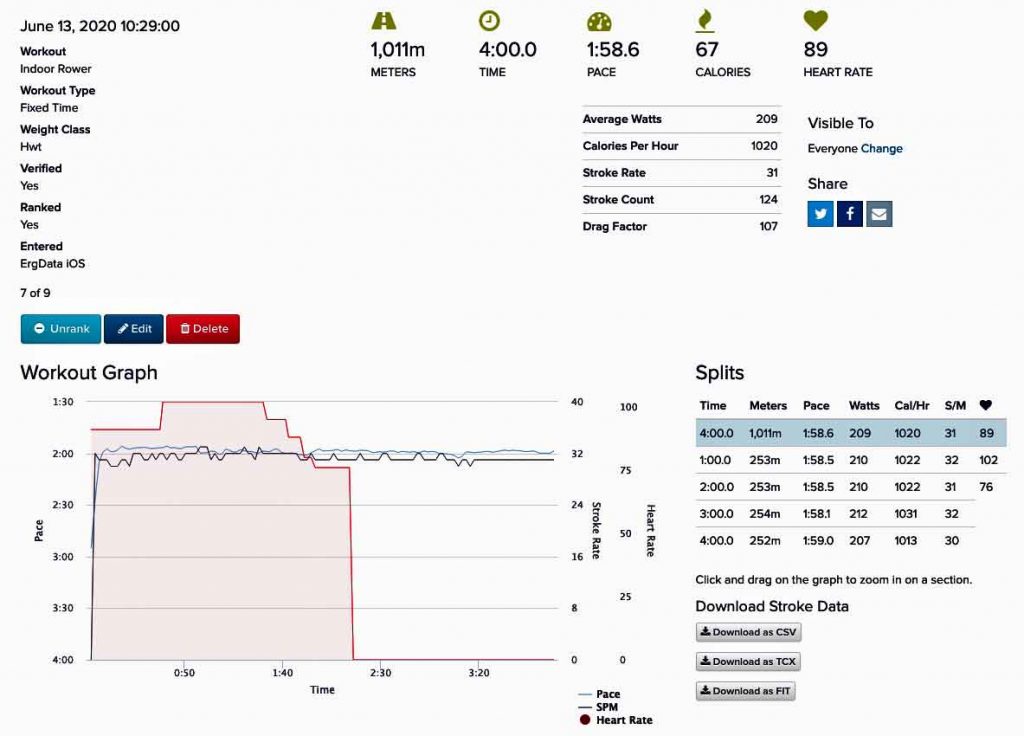
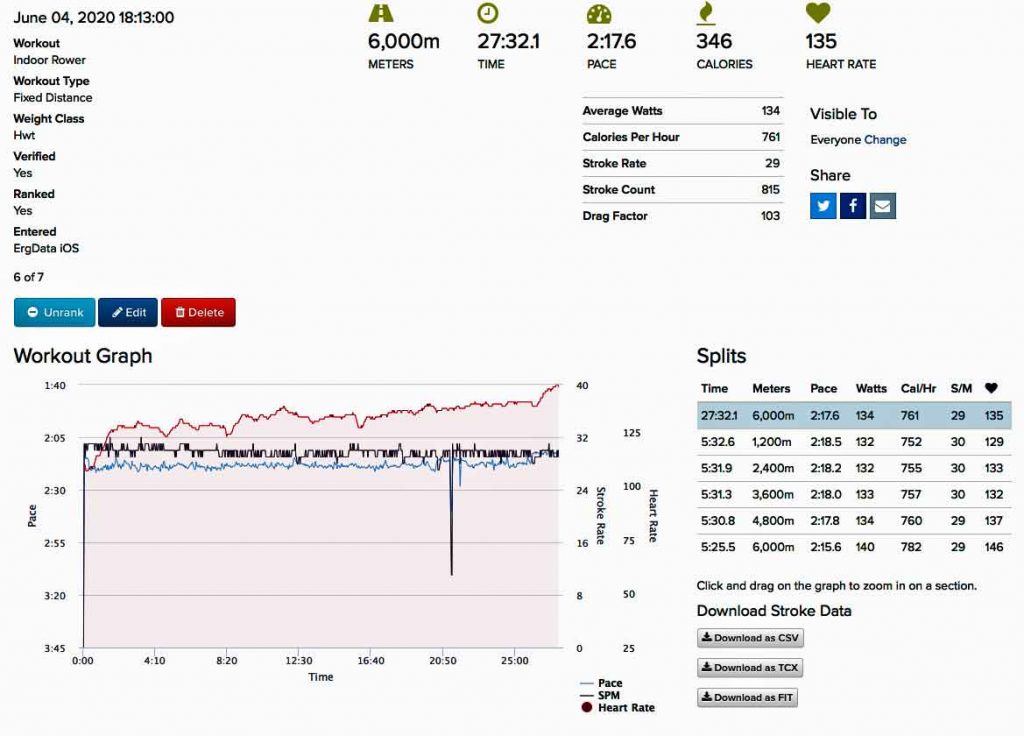
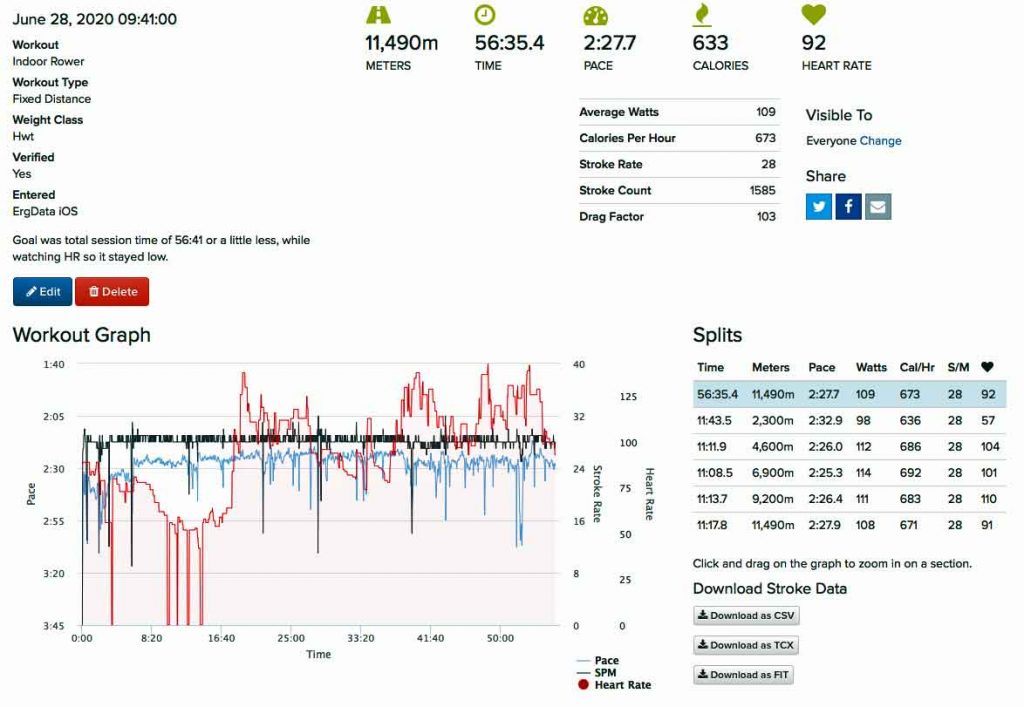
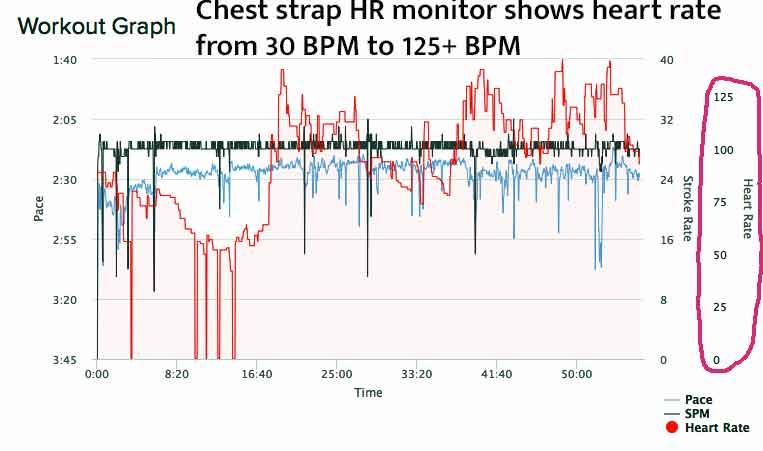
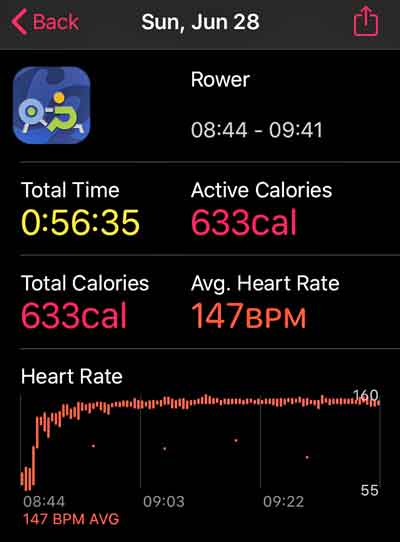
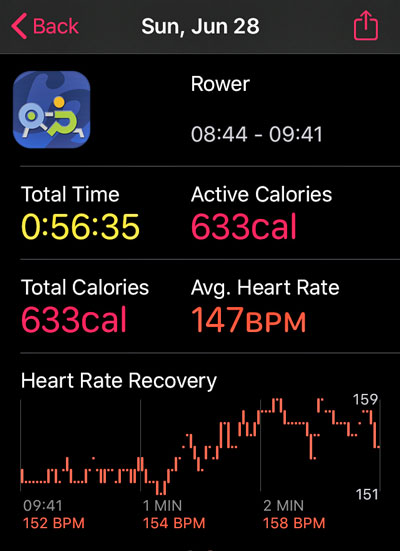
The Garmin chest strap gave a much lower BPM reading than the Scoshe armband. By that I mean the Scosche displayed a heart rate which was between 140-160 BPM most of the time while the Garmin was giving a reading ranging from 30 BPM to as high as around 125 BPM. For much of the time the Scosche heart strap reading was 200% to 300% higher than that from the Garmin heart strap.

I experienced atrial fibrillation all of last night and it persisted to and through the rowing session so that was probably the main reason for the strange difference in heart rate readings. My vague theory as to why the big difference is: I assume the Garmin uses an algorithm that chooses the strongest periodic electrical signals which are also above a certain level and then averages those. When atrial fibrillation is happening the heart beats a lot faster than normal but some of its beats are stronger, others are noticeably weaker (if a finger is held on the wrist to feel the pulse) and heart rate varies & wobbles with incoherent rhythms. Therefore since the Garmin was (I assume) paying attention to only the strongest signals and ignoring weaker signals, that’s my opinion as to why it resulted in a much lower heart rate display: it wasn’t actually counting each and every beat of the heart, only the stronger ones.

Contrastingly the Scoshe heart strap doesn’t detect or measure electrical signals at all. Instead it only detects periodic variations in reflected light as the blood flow speeds up and slows down with each beat, no matter how strong or weak each heartbeat is. So based on that assumption that’s my opinion as to why the Scosche heartstrap always shows a higher heart rate than the Garmin, when atrial fibrillation is happening: It “sees” more heartbeats because it counts not only the heartbeats associated with the stronger electrical pulses that the Garmin counts, but also the heartbeats associated with the weaker electrical pulses which the Garmin does not count.

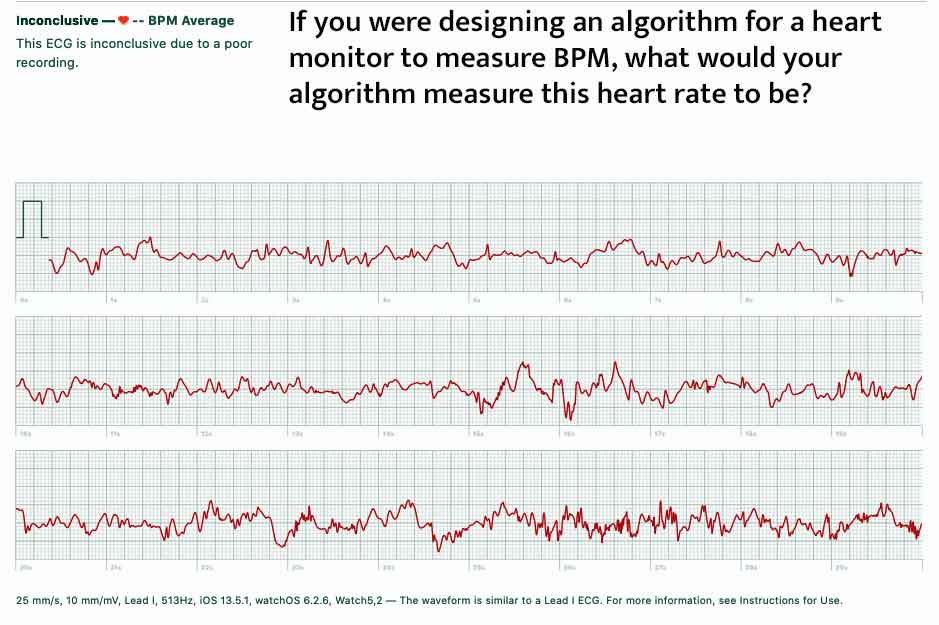
Screenshots below show heart rate graphs from both the Garmin and Scoshe heart straps so you can see a bit of what I’m trying to write about. Below those two sets of screenshots is another screenshot of a typical ECG reading of what my heart rate is doing right after I finish a workout session on the rowing machine. I don’t discern any particular heart rate in that graph, do you? Based on a non-mathematical analysis of that graph I’d be at a complete loss as to what heart rate should be displayed by any heart rate monitor.

Full view screenshot of today’s rowing workout data and graph as it is presented in the Concept 2 online logbook.
Closer view of the Concept 2 online logbook graph for today’s rowing workout. This HR graph was made from data supplied by the Garmin electric-pulse sensing chest strap. Notice how much lower the heart rate range is in this graph than in the ones (below) from the Scosche optical heart straph.
This heart rate graph for the same rowing session was made using data from the Scosche optical blood-flow-pulse sensing heart strap. It shows an average heart rate of 147 BPM, which is much higher than the highest heart rate displayed by the Garmin chest strap.
Though I didn’t mention it above, this is a two minute graph using Scoshe optical heart strap data of my heart rate recovery. It should go down, not up, during the two minutes immediately after a rowing session ends. The average heart rate during this two minutes of recovery is 152 BPM, which is higher than the average 147 BPM it measured when I was actually rowing. There is no heart rate recovery graph from the Garmin chest strap so no comparison can be made between them for the 2 minute recovery time.
When I’ve taken a 30 second ECG immediately following a rowing workout, this is usually a typical result: neither sinus (normal) rhythm nor atrial fibrillation, but “Inconclusive” because no sensible periodic readings can be detected.

Though there hasn’t been a blog post made since June 25th, there have been daily workout sessions from then through today. Any session can be seen via this: link to the online logbook. To see any session’s data and interactive graph click the corresponding “+” sign in the “Action” column for that session.

Happy rowing to you!

Faster But Easier

Today’s daily rowing session was the same distance as yesterday’s, 11,490 meters. It was a bit faster than yesterday’s session but it felt easier and was definitely more fun than yesterday’s. The average pace for yesterday’s was 2:35.7/500 meters and the average pace for today’s was 2:26.9/500 m. That amounted to a calorie burn difference of 20,000 calories more today than yesterday.*

Screenshot of today’s chart and data.
Screenshot of yesterday’s chart and data.

Though there hasn’t been a blog post made since June 14th, there have been workout sessions every day from then until today. Any of the workouts can be seen via this: link to the online logbook. To see any session’s data and its interactive graph, click the corresponding “+” sign in the “Action” column for that session.

Happy rowing to you!

* The 20,000 calorie difference between today’s and yesterday’s sessions is actual calories. For those of you who are acquainted only with the analysis listed on the backs of food packages, those energy values are kilo-calories or “food Calories”. The difference in energy expended in today’s rowing session compared to yesterday’s was 20 kilo-calories or 20 food Calories. But I like the sound of 20,000 calories better because though it is the same amount of energy it sounds like a lot more.

Warmup Needed After Workout

The view from where I sat while warming up after today’s morning workout.

Today’s workout was done all in one session, almost first thing in the morning after getting out of bed. The idea was to get it over with. The session was 11,490 meters on the rowing machine. The distance of 11,490 meters was my daily average distance for the previous rowing season and it was chosen as this season’s minimum daily distance.

Afterwards I felt chilly so I poured a cup of coffee and went outside to warm up. The outdoor temperature was 102 F in the shade (38.9 C) but I wanted even more heat than that, so I unlocked the back door of the truck and climbed inside to sit with the cup of coffee and then closed the door. It was quite a bit warmer in the truck, since the truck was sitting in the sunshine.

It felt very nice and toasty warm like a sauna. By the time the coffee was gone I was warmed up and went back into the house.

Any of the other workouts can be seen via this: link to the online logbook. To see any session’s data and its interactive graph, click the corresponding “+” sign in the “Action” column for that session.

Happy rowing to you!

Four On The Floor

Today was a deliberately low-energy rowing day, as most days have been since I began the “detraining” in January of this year.

The day’s workout time was divided into 9 sessions totaling 11,490 meters, which is the current minimum daily quota. The main session was not the longest but it was at a degree of higher energy than most of the rest. It was 4 minutes rowing with a target pace of 1:58.7. I overshot the pace a bit and ended with an average pace of 1:58.6.

I didn’t anticipate that the pace of 1:58.7/500m for a mere 4 minutes would bother my heart, but it seemed to be the trigger for a few hours of atrial fibrillation. The Afib cleared up a few hours later when I did about 20 minutes of easy rowing to finish the day’s workout quota.

If you look at the red line for heart rate in the screen shot of the graph (below) for the 4 minute piece, you can see that heart rate wasn’t charting where it should have been. Atrial fibrillation seems to confuse the electronics of the heart strap and make messy, non-sensical heart rate graphs.

Screen shot of the Concept2.com online logbook chart and some data for today’s 4 minute rowing piece.

If you are curious about any of the other workouts I’ve done since the previous post on June 4th, all data and “live” graphs can be seen via this: link to the online logbook. To see any session’s data and its interactive graph, click the corresponding “+” sign in the “Action” column for that session.

Happy rowing to you!

Another Day of Detraining

One definition of the word “detrain” means to disembark from a train, but I’m using a different meaning of that word in the context of this blog…

It’s been 23 days since the previous blog post, but who’s counting? Between today and 23 days ago, there have been 34 attempts to post spam messages into comments and zero actual comments from real people and that’s the only publicity those spammers will get because their spam goes directly into the trash.

Speaking of trash, there have been a lot of trashy looking heart rate graphs for many of the workout sessions during the past 23 days. But there have also been a few nice looking graphs during that period. One of today’s workouts, a moderate paced 6K rowing session, had one of those nice looking graphs. By “nice looking,” I simply mean that the heart was behaving normally instead of going into atrial fibrillation.

This month is the sixth month of my effort to “detrain” my heart by working out at effort levels that are much lower than I had been doing before the atrial fibrillation started to become a big problem. So far, it seems to be helping and that is a bit surprising because I have no guidelines to follow and don’t really know what I’m doing except that I’m “taking it easy” with regard to using the rowing machine and SkiErg.

One of the workouts done today was a 6K rowing piece with a target pace of something a little faster than 2:20/500m. It went well and a screen shot of the results is below.

Screenshot view of today’s 6,000 meter rowing session. There were 7 sessions today but this was the main one.

If you are curious about any of the other workouts I’ve done in the past 23 days, all data and “live” graphs can be seen via this: link to the online logbook. To see any session’s data and its interactive graph, click the corresponding “+” sign in the “Action” column for that session.

The only other news that comes to mind with regard to this blog is that today I decided to add another page to this blog. Its title is “Something Else” and it will be about something else other than rowing. I started it today by giving it a title and writing a couple of sentences but it doesn’t appear on the blog yet because I don’t remember how to make it visible in a tab at the top of the page like the other pages. So the next thing I need to do is consult with my better half for her expertise to help in figuring out how to get that new page to display in a tab at the top of this blog like all the other pages do.

Happy rowing to you!