Today’s workouts totaled 15,968 meters. Everything but a 10K rowing session was either warmup or warmdown. The day’s activity and graphs etc can all be viewed at this online logbook link by looking for the log entries done on today’s date.
The main workout was another 10K rowing session. It was done with the goal of averaging a steady pace of 2:33.8/500 meters.
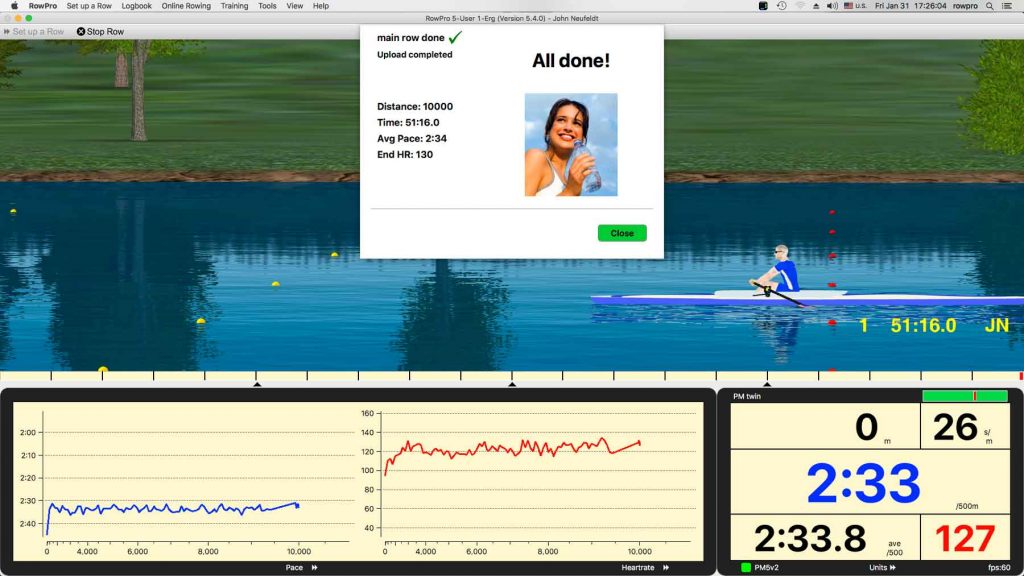
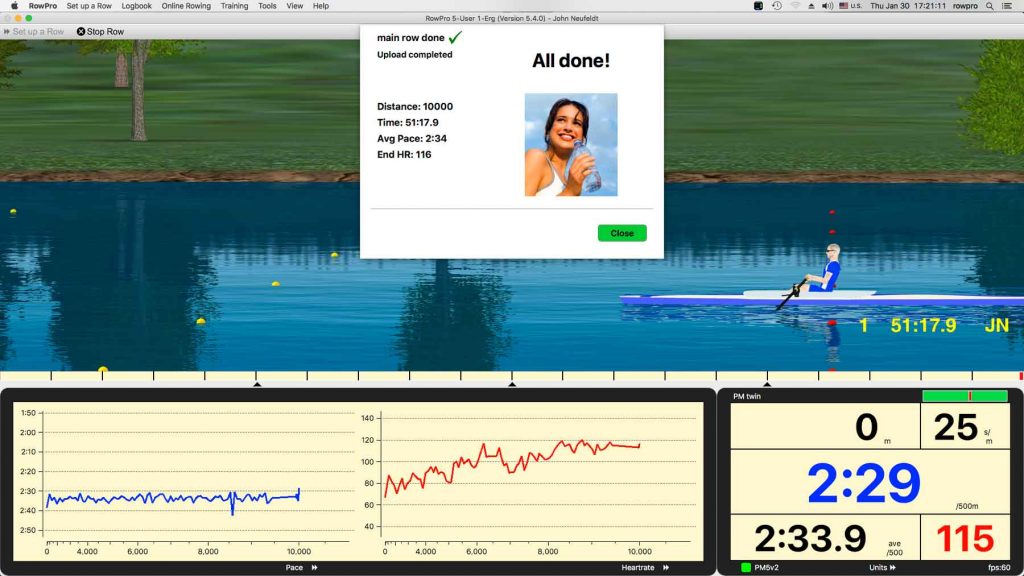
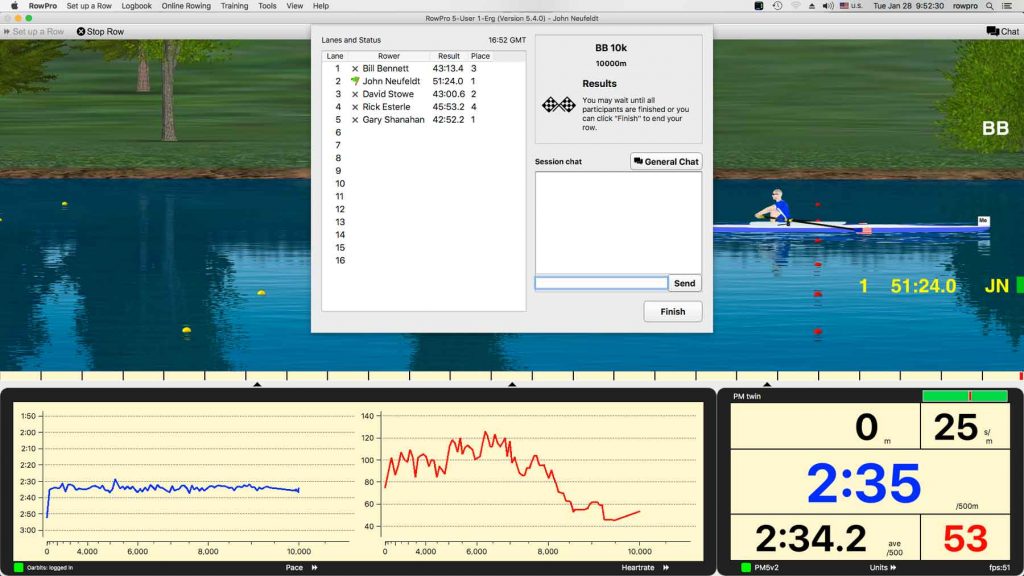
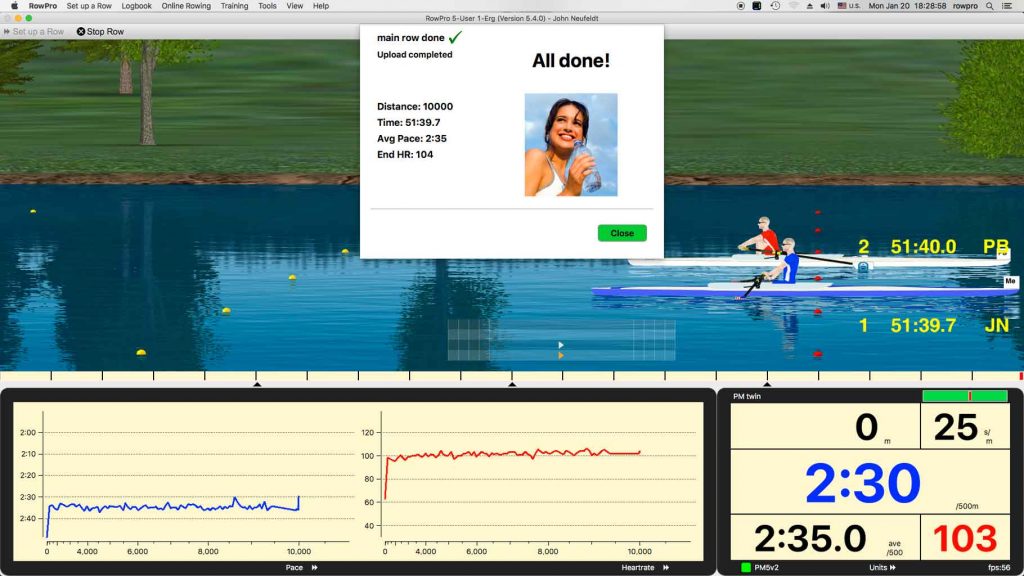
Finish screen view of RowPro after the 10K rowing session.
Today’s working out consisted of a morning session of online rowing for 30 minutes, a couple short SkiErg sessions in the afternoon and a 10,000 meter rowing session. Data views for the 10K will be shown here. Data for the others done today can be viewed by going to this link for my online logbook and looking for sessions done on today’s date.
During the 10K rowing I wore two heart straps. A Garmin electric signal sensing heart strap supplied data for the RowPro software and a Scosche optical sensing heart strap supplied data for the other graph (the green-on-black graph) which you will also see here. The data from the two heart straps was usually wildly different so I don’t know if either of them was giving an accurate or relevant readout. Two independent witnesses must agree, for their testimony to be reasonably regarded as truth.
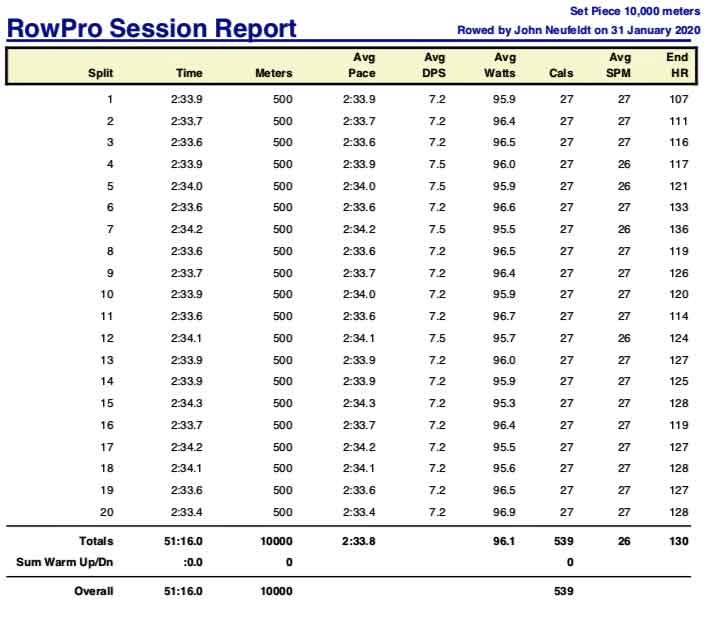
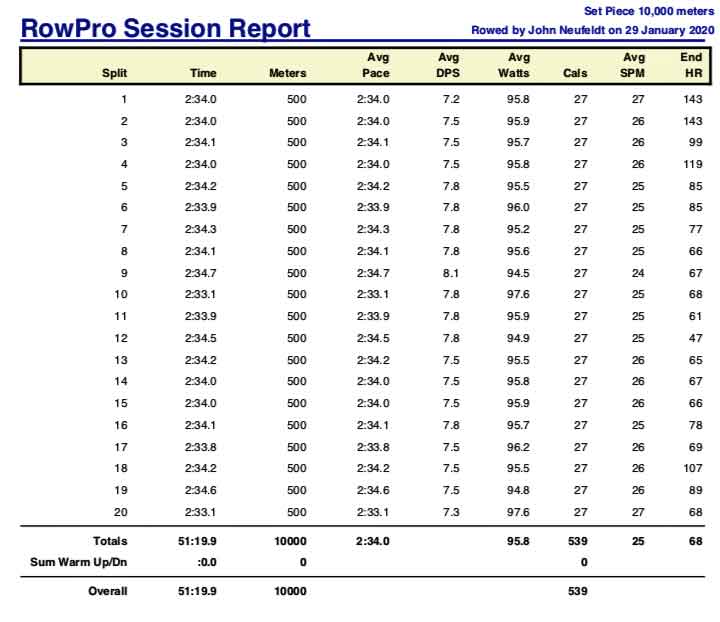
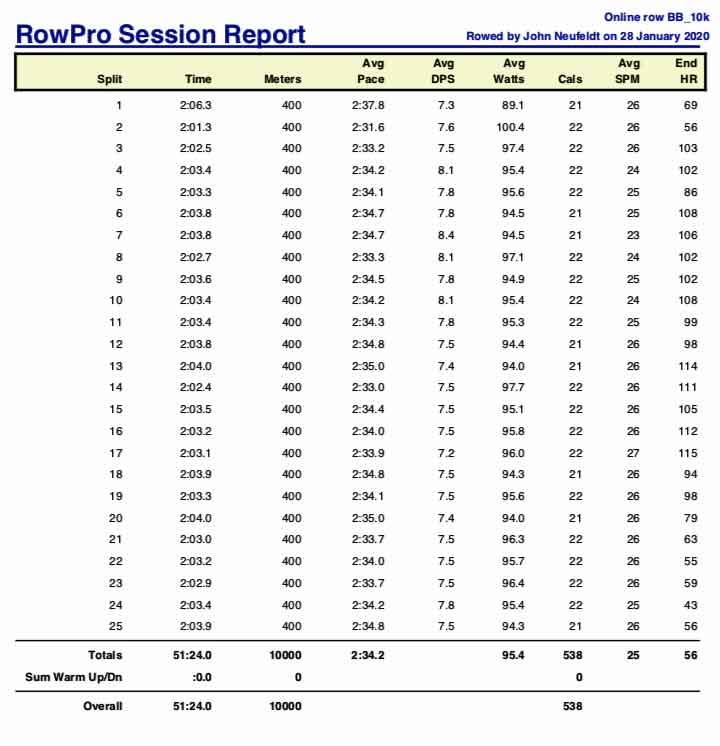
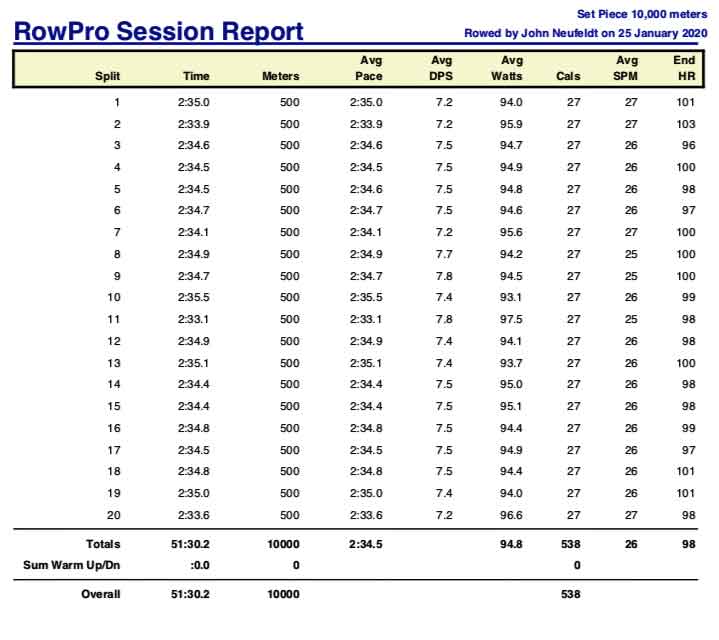
RowPro report for 10K rowing session.
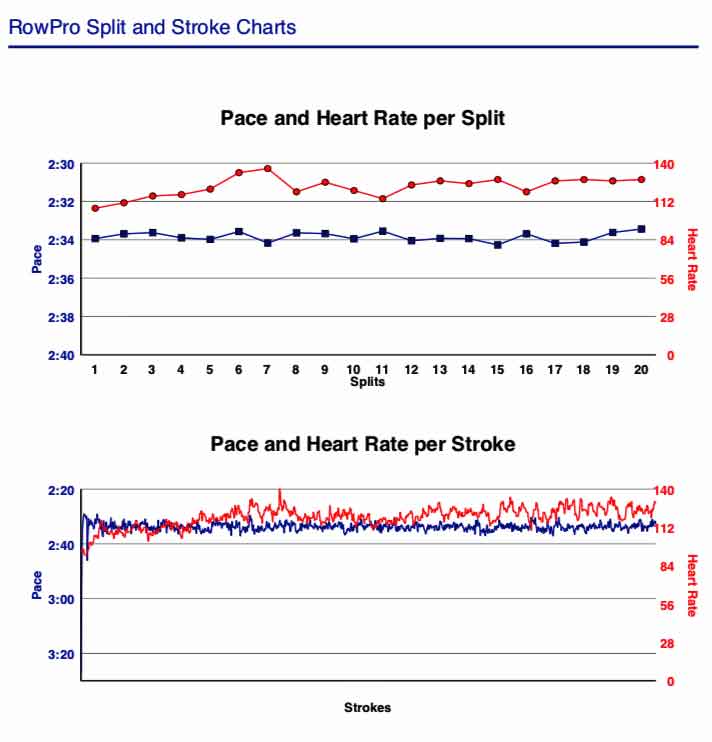
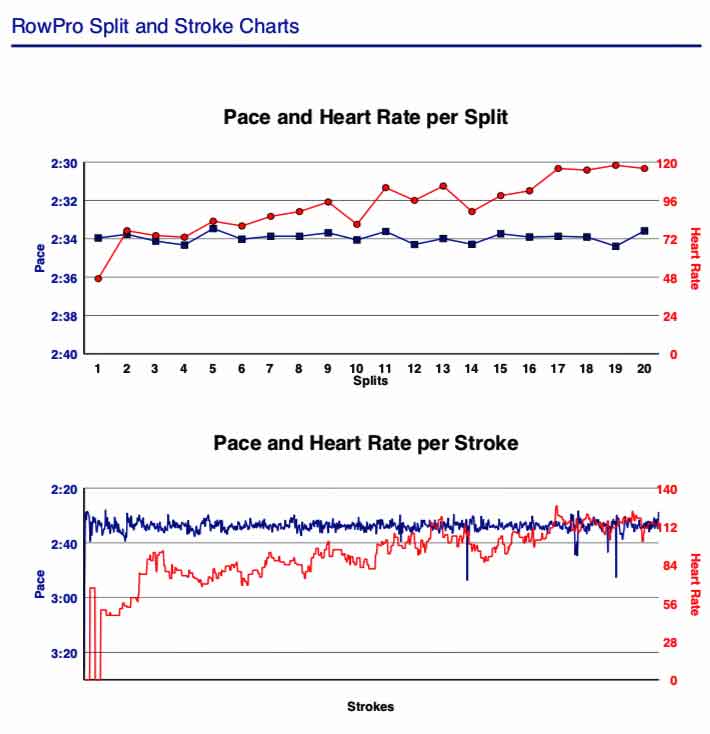
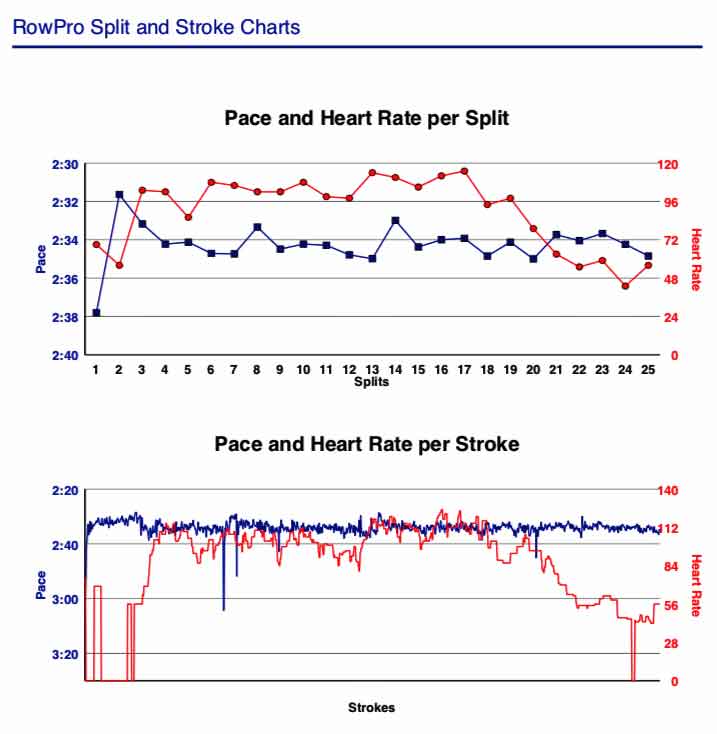
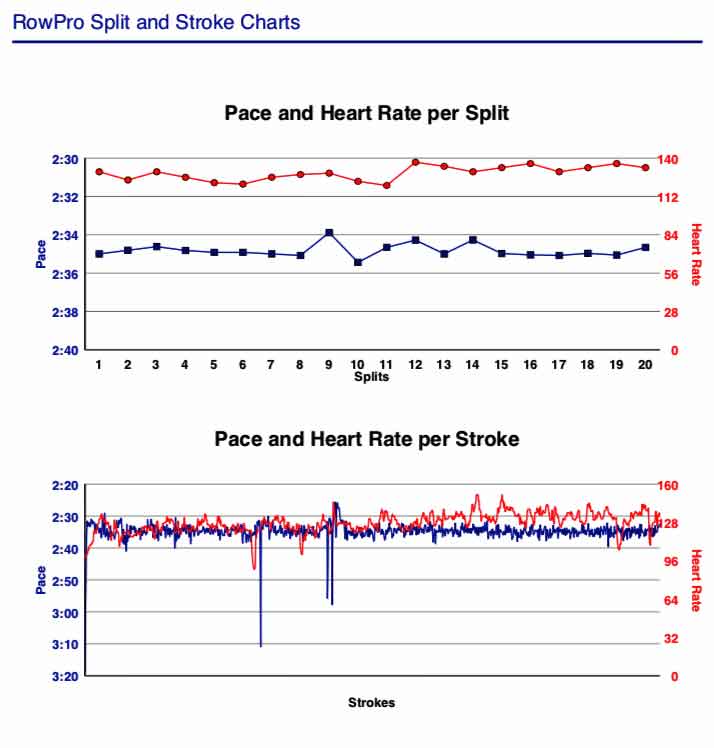
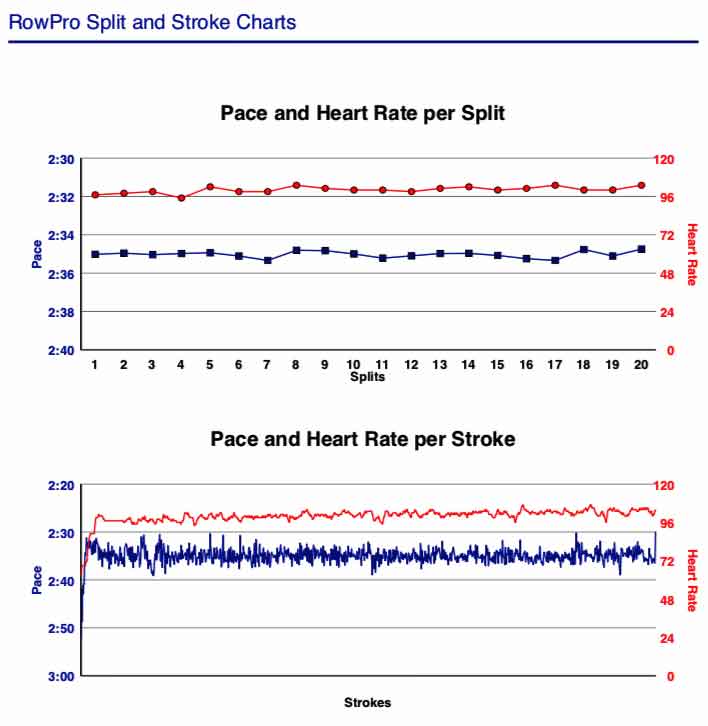
RowPro graphs for 10K rowing session.
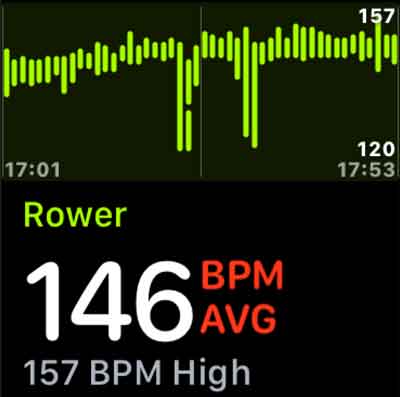
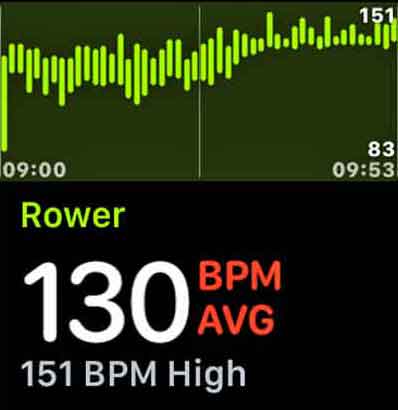
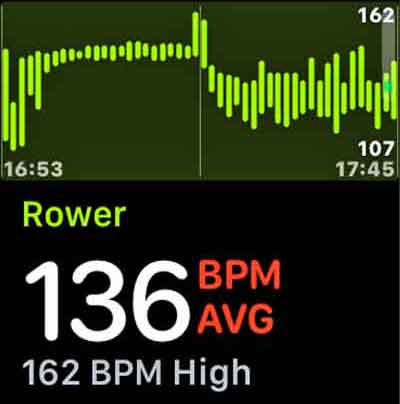
Heart rate graph for 10K session, using data from Scosche optical heart strap.
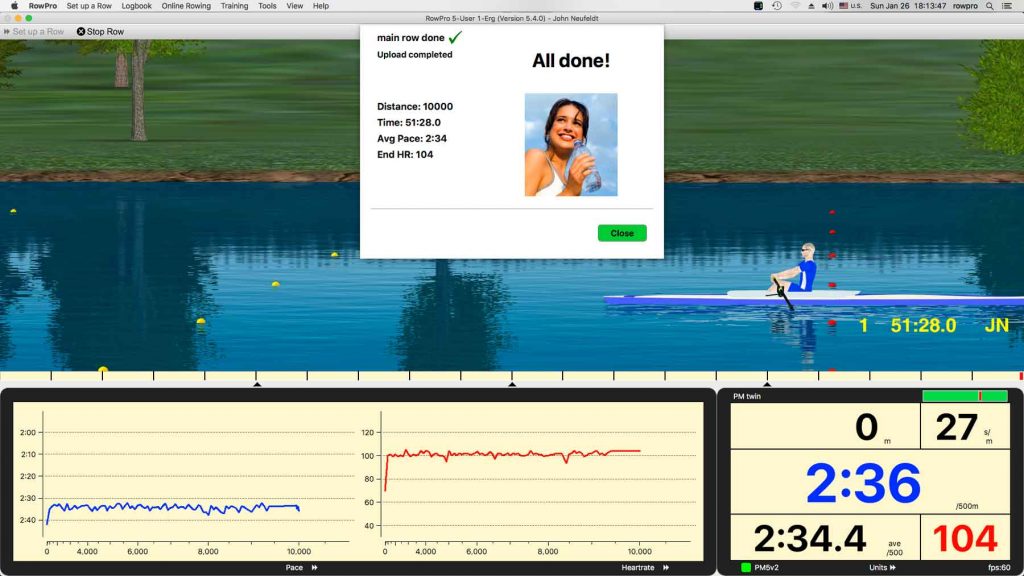
Finish screen view of today’s 10K indoor rowing session.
I don’t know the answer to the question in today’s title. But today was another of those sometimes when the heart was haywire. Aside from that, everything was okay.
Today’s workouts consisted of two: First there was a SkiErg session of 6,003 meters to serve as a warmup. The distance of 6,003 meters was chosen because it was the exact same distance, in miles, that one of my sons ran during one of his workouts today: 3.73 miles. Graphs and data will not be shown here for the SkiErg session but they can be viewed via this: link to my online logbook if you look for the SkiErg session that was done on today’s date.
The main workout today was 10,000 meters indoor rowing at a steady average pace of 2:34.0/500m. The rowing session was uploaded to YouTube as a screen recording for those of you who would like to row-along or race with it. It can be found on YouTube at this link: “Indoor Rowing 10K at 2min 34sec/500 meters 01292020”
Today, like yesterday, I wore two heart straps and there is a heart rate graph for data from each of those heart straps. The two graphs look very different from each other, so I don’t know if either of them has accurate heart rate data. I was having atrial fibrillation during the rowing session, so that’s probably the general cause for the disagreement between the two heart straps.
Report for today’s 10K rowing.
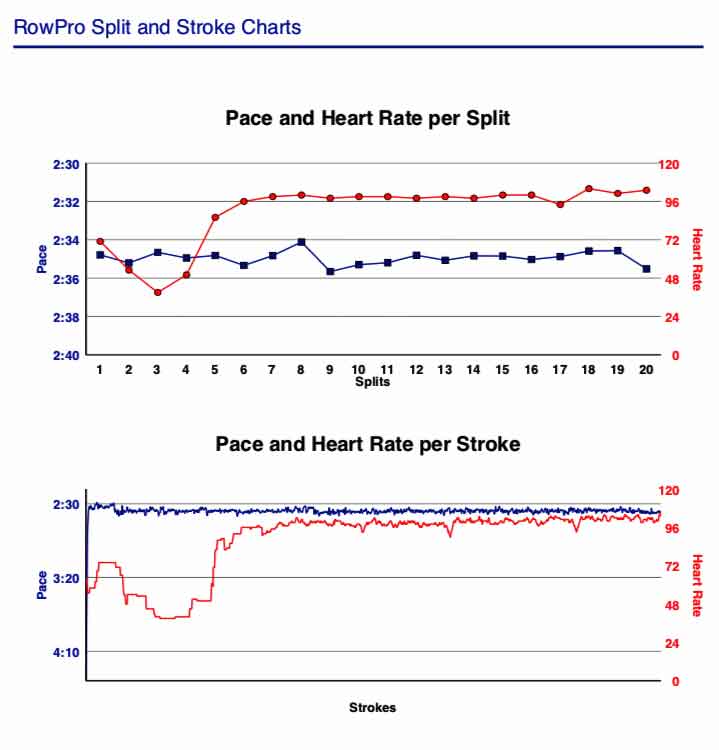
RowPro graphs for today’s 10K rowing session. The heart rate data for this graph came from a Garmin chest strap.
A Scosche heart rate arm strap supplied the data for this graph of heart rate during today’s 10K rowing session.
Finish screen view at the moment after completing the first 10,000 meter rowing session.
Today’s workout time consisted of an online 10,000 meter rowing session in the morning and an offline 10,000 meter rowing session in the afternoon.
The morning 10K was done at a steady average pace of 2:34.2/500 meters and the afternoon 10K was done at a steady average pace of 2:34.1/500 meters. There was also a 1K rowing warmup and a 1K rowing warmdown in the morning and a 56 Calorie SkiErg warmup in the afternoon. They and their interactive charts and data can all be viewed in at this link: in my online logbook. The only data and screenshots shown here will be for the two 10K rowing sessions.
The heart behaved in a rather haywire fashion in both of the 10,000 meter rowing sessions.
There were two heart straps used, simultaneously, during each of the two 10,000 meter rowing sessions. A Garmin heart strap was worn on the chest and supplied data for the RowPro graphs. The other graphs used data from a Scosche heart strap worn on the arm. The heartbeat signal appeared to be doing one thing in the chest and something a bit different in the arm.
I was having atrial fibrillation before, during and after each of the 10K rowing sessions.
Report for the first of two 10,000 meter rowing sessions.
RowPro graphs for the first of two 10,000 meter rowing sessions.
Scosche heart strap data heart graph for the first of two 10K rowing sessions. Notice that this graph, though it is of the same session as the RowPro graphs above, does not look like it was the same heart in the same session.
Finish screen view at the moment after completing the second of two 10,000 meter rowing sessions.
Report for the second 10,000 meter rowing session.
Graphs using Garmin heart strap data, for the second of two 10,000 meter rowing sessions.
Graphs using Scosche heart strap data, for the second of two 10,000 meter rowing sessions.
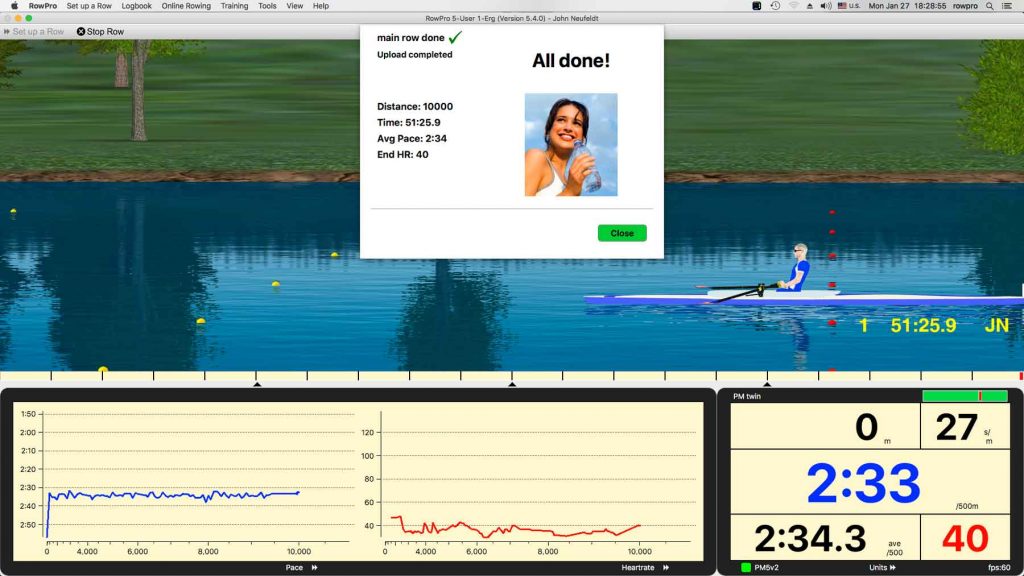
Finish screen view of today’s 10,000 meter rowing session. Notice how irrationally, unrealistically low, at 40 BPM, was the heart rate displayed from the chest heart strap at the moment the 10K was completed.
Today’s main workout was 10,000 meters rowing with the goal being to row at steady pace averaging 2:34.3/500 meters.
There were two heart straps worn, each with its own receiver providing a heart rate graph. The Garmin chest strap provided intermittent readings and they were all irrationally low. The Scosche heart strap, which was located on an arm, gave continuous, reasonable, rational readings. You can see their two graphs below. (The RowPro graph is from the Garmin heart strap.) There were a few SkiErg sessions done as warmup. If anyone wants to see their graphs & data, they are viewable via this link to my: online logbook.
RowPro report for today’s 10K rowing. The “End HR” column shows heart rate from the Garmin chest strap at the end of each of the twenty 500 meter splits of the 10K session. Even though I was rowing at a very low effort level, my heart rate is never that low when rowing at any speed.
RowPro graphs for today’s 10K rowing session.
The data on this heart rate graph is from the Scosche heart strap which was worn on the arm. Its heart rate data seems totally normal.
Screenshot of the finish of today’s 10,000 meter rowing session.
Like yesterday, today’s heart rate & rhythm were happily normal.
Today’s workouts consisted of 10,000 meters rowing, which was the main part. There were also a half dozen or so short and easy sessions on the SkiErg. This blog post will only show information about the rowing session. Graphs and data about everything else can be viewed in my public log at this link.
Though I haven’t posted about it for a couple of days, I’ve been continuing with doing workouts daily. The workouts done (and their graphs) during the days when nothing was posted to this blog can be viewed in my online logbook via this link.
Heart rate was busy with atrial fibrillation during those days which had no blog entries. But TODAY the heart was and still is acting NORMAL! Hooray!
I’m starting to wonder, though, if acting normal is “just a phase?”
Today’s workout activity was more “detraining,” which is to say that it was done at a very low level of effort. If you have read the relevant earlier posts in which I mentioned the book titled “The Haywire Heart” then you know that one of the possible solutions to rid oneself of atrial fibrillation is to “detrain,” which theoretically might reverse or allow to heal whatever damage was done to the heart with excessive training which caused the atrial fibrillation.
Today’s workouts consisted of five sessions of 50 calories each on the SkiErg and those served as a warmup for the rowing session. The rowing session was 10,000 meters at a steady pace with the goal being to average a pace of 2:34.5/500 meters.
Finish screen view of today’s main workout, 10,000 meters rowing.
There was (and still is as this is being written) some atrial fibrillation which started early this morning and persisted throughout the workout session.
So the workout wasn’t super good. But the AF wasn’t as extremely annoying as some episodes have been, so it didn’t interfere with the workout plan, which was to row at a steady pace which would average 2:34.8/500 meters.
Because of the Afib, heart rate aranged from 20 to 30 BPM higher than it would have been if the heart had been behaving normally.
The workout was 10,000 meters rowing. It was preceded by a slow 100 Calorie warmup session done on the SkiErg.
Today’s workouts consisted of a few morning sessions on the SkiErg and a 10,000 meter rowing session in the afternoon.
The title of today’s blog post refers to the fact that the two heart rate monitors I was simultaneously using during the 10K session had a pointless argument during the first fifteen minutes of that session.
I wore two heart rate monitors: A Garmin chest strap (which is what RowPro used for its heart rate data) and a heart rate monitor on the wrist. The heart rate monitor on the wrist showed a reading of near 100 BPM for the entire rowing session but the RowPro heart rate display and graph showed an impossibly low heart rate – which was about half or less than half of what it should have been, for the first 15 minutes of the session.
The two heart rate monitors continued their pointless argument, in radical disagreement for the first fifteen minutes, after which the RowPro heart data gradually rose and finally began displaying normal readings that agreed with the wrist heart rate monitor.
Report for 10K
RowPro graphs for 10K
Heart rate graph of 10K, from wrist-watch heart monitor.
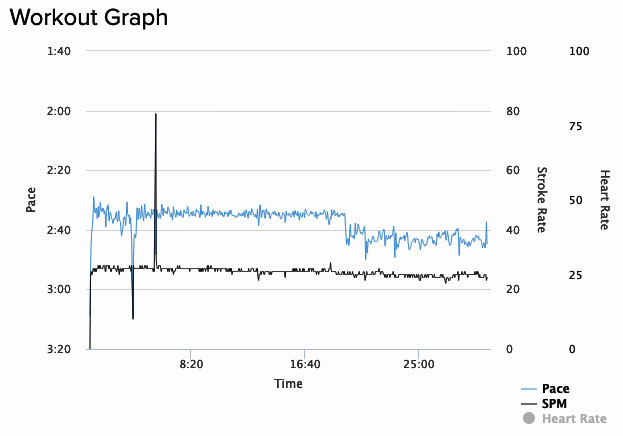
Graph of rowing pace (blue) and rating (Strokes Per Minute-black) for this morning’s 30 minute session. There is no heart rate graph on this chart because I didn’t wear a heart strap monitor synched to the PM.
Today’s workouts were divided into morning and afternoon sessions. The morning session was online with six other guys, at 09:00 local time. The online session was a 30 minute “handicap chase”. It was structured so that the “turtle” (the slowest rower) would begin rowing immediately at the start and the other rowers would wait at the starting line for an amount of time depending on their planned rowing pace, that would allow them to catch up with the “turtle” after about 5,000 meters and then everybody would row together the remaining distance from 5,000 meters to the finish line when 30 minutes was completed.
I was planning to row the slow pace of 2:35 and start about 10 seconds after the “turtle” but he announced that he was going to row slower than his usual, so I waited about 50 seconds after the start signal before I began rowing.
At the top of this blog post you can see a graph for the 30 minute session. After 50 seconds of motionless waiting I started rowing, aiming for a pace of 2:35. When there was about 9 or 10 minutes of the 30 minutes remaining, I caught up to the “turtle” and for the remainder of the session I matched his pace and rowed alongside him. You can see on the graph how the effort level (pace, which is blue on the chart) is fairly constant at one level for about the first 2/3 of the session and then it becomes lower for the remainder of the time when I was matching the pace of the other rower.
I was wearing a heart rate transmitter chest strap, but it wasn’t displaying a reading, so I removed it with one hand while rowing with the other hand so that it wouldn’t distract me from focusing on pace.
I was also wearing a wrist watch to log the workout to the daily “Activity App” and the wrist watch had its own heart rate monitor which was displaying heart rate. I glanced at it several times during the session and saw that heart rate immediately climbed too high at the beginning, went even higher and then settled down to a normal rate.
I chose not to do any warm-up at all before the session began, because my planned pace of 2:35 was as slow or slower than the pace I’ve used many times for warming up.
But without atrial fibrillation happening (thank God!) my resting heart rate was almost normal at around 50 BPM. (normal resting heart rate for me is in the 40’s). I’ve read that the lower the resting heart rate, the greater the chance that some of the heart’s “rogue” timing cells will prematurely fire. I’ve also read that the hearts of competitive rowers are less “adaptable” than hearts of runners or swimmers, so perhaps the heart was being finicky / persnickety and needed either a more gradual start or an ultra-slow warmup (?) Or maybe the heart just wanted to start out full-blast at maximum effort, like a rower would do in a short distance race (?)
Here is a screen shot of the heart rate graph from the watch, so you can see how heart rate behaved during the 30 minute session:
During the 30 minute session, heart rate while waiting was 53 BPM then it shot up to 130-140 after the start of rowing and climbed as high as 189 before settling down to a normal rate.
For the afternoon workout session, I did an ultra-slow warmup on the SkiErg, of 50 Calories at a pace of about 3:00/500m. The heart didn’t seem to complain about that.
Following the SkiErg warmup, the main and final workout of the day was 10,000 meters on the rowing machine at a steady average pace of 2:35.0/500m. The heart rate and rhythm were both well-behaved during the 10K.
The screen recording is a silent. No sound track. Supply your own sound effects or preference of background music if you want to hear more than the singing of the chain of your rowing machine.
Here are screenshots relating to today’s afternoon 10,000 meter session: