Inspiration for today’s bit of workout time came from my training partners. Four of them had logged workouts today. I looked at what they had done, released the reins of my thoughts and the next idea that trotted into my head was: do four separate workouts, each at the average pace done in each of 4 workouts done by my training partners.
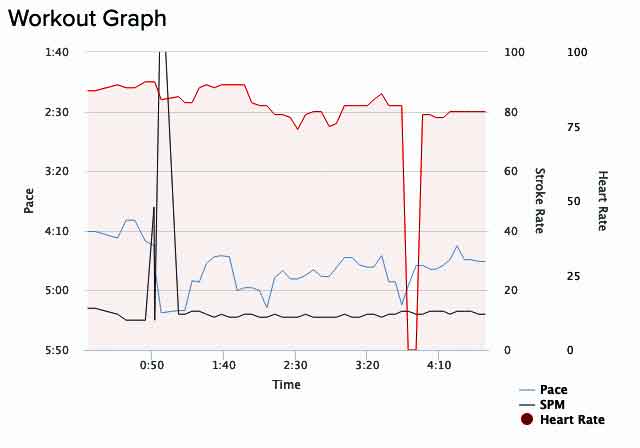
I started with the one that had been done at the slowest average pace of 4:44.2 per 500 meters. I made that the shortest distance workout of 500 meters. It turned out to be the hardest goal to reach and I came close but failed by ending up with an average pace of 4:45.4 instead of 4:44.2. I couldn’t get the hang of maintaining a steady pace near 4:44.2.
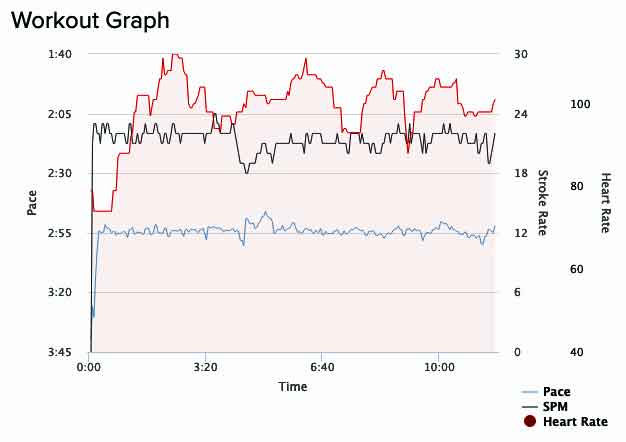
The second workout session was easier. In fact, all of the remaining sessions were easier because I found it much easier to stay near the projected target pace when the target pace was a bit faster than 4:44.2. The second one was 2,000 meters with an average pace target of 2:54.2/500m.
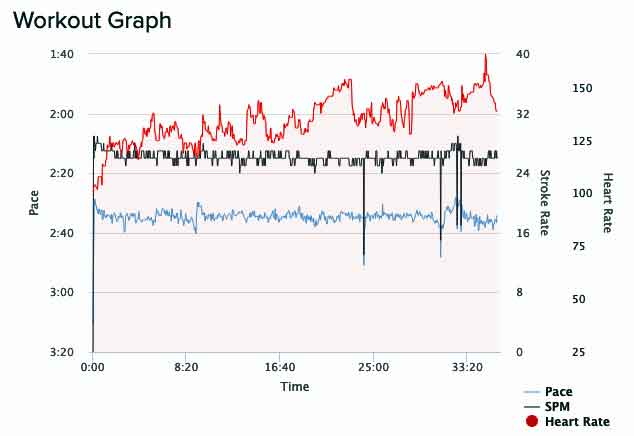
The third workout session was 7,000 meters with an average pace target of 2:34.2/500m.
None of the 4 workout sessions were fast but the 4th workout had the fastest target pace of 2:22.7/500 meters. The distance chosen for the 4th session was 4,000 meters. But the session was interrupted before 1,000 meters was completed when the iPhone and ErgData app lost its connection to the PM5 monitor or the WiFi network. So that 4th session was divided up into two sessions that totaled 4,000 meters.
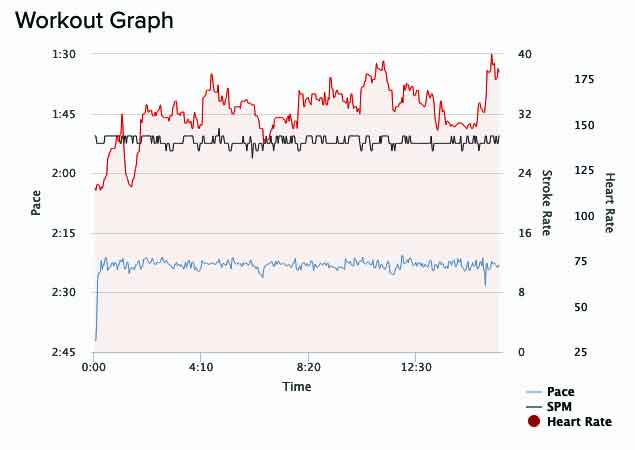
There were actually six sessions done today. They were the four above mentioned, a brief test session at the start and another session because the 4th session was interrupted and broken up into two pieces.
The goal for each session was a steady average pace. That goal was mostly achieved. But heart rate was something else because the heart was still in atrial fibrillation for… what? the third day now? So the heart rate graphs wandered and did not resemble the graphs of the pace.
All today’s data and live, granular clickable graphs can be seen via this link to the online logbook. To see any session’s data & clickable interactive graph, click the corresponding “+” sign in the “Action” column for the particular session.
Happy rowing to you!
