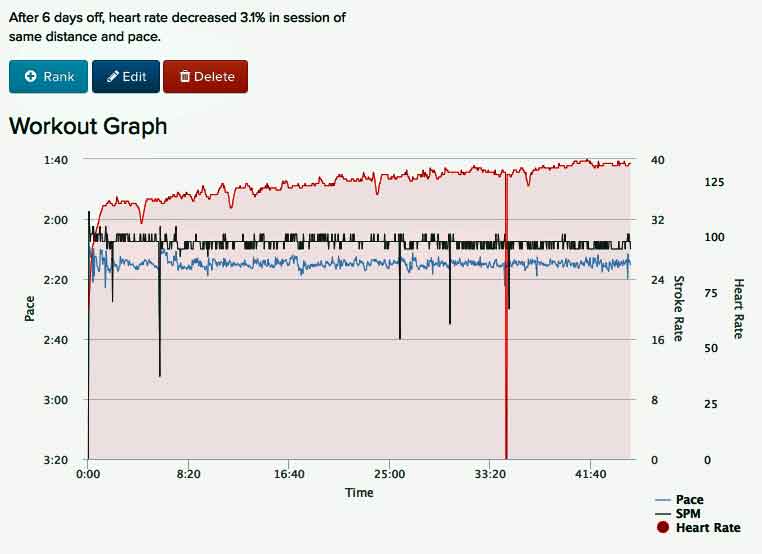
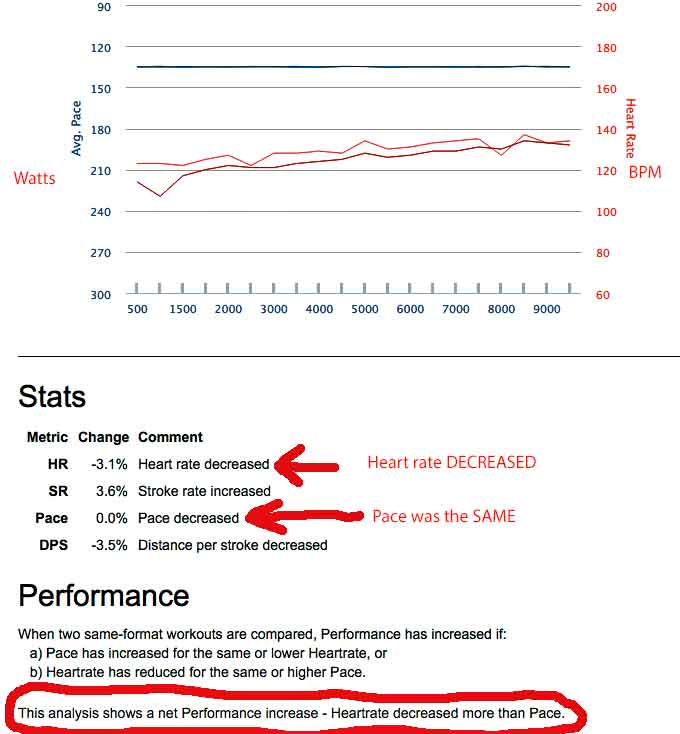
“Look on the bright side of things,” says my mind to itself. After being on the not so bright side of things and doing no workouts for 6 days, today’s workout showed a net performance increase. Perhaps that’s because I was so very well rested. Over-rested.
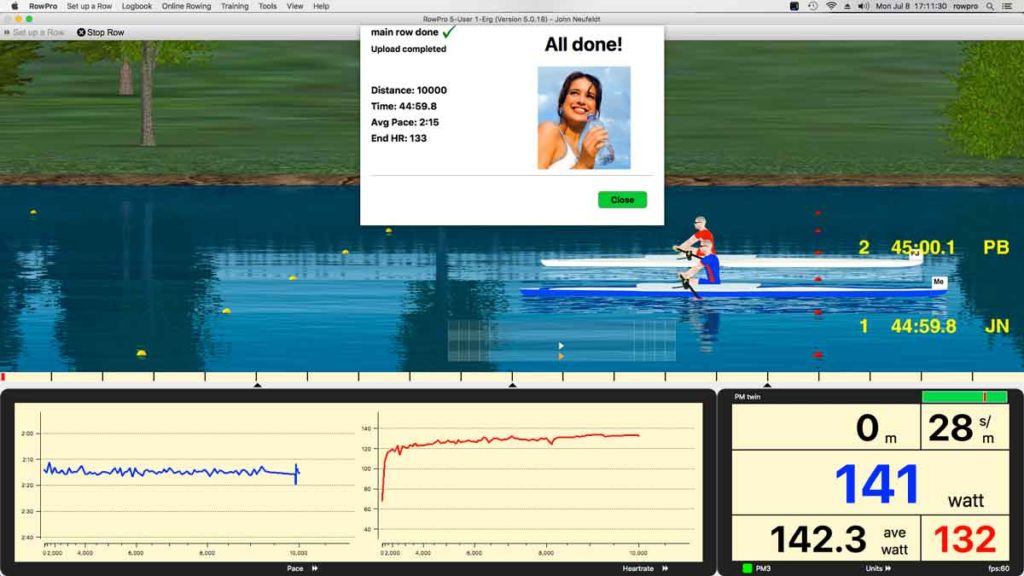
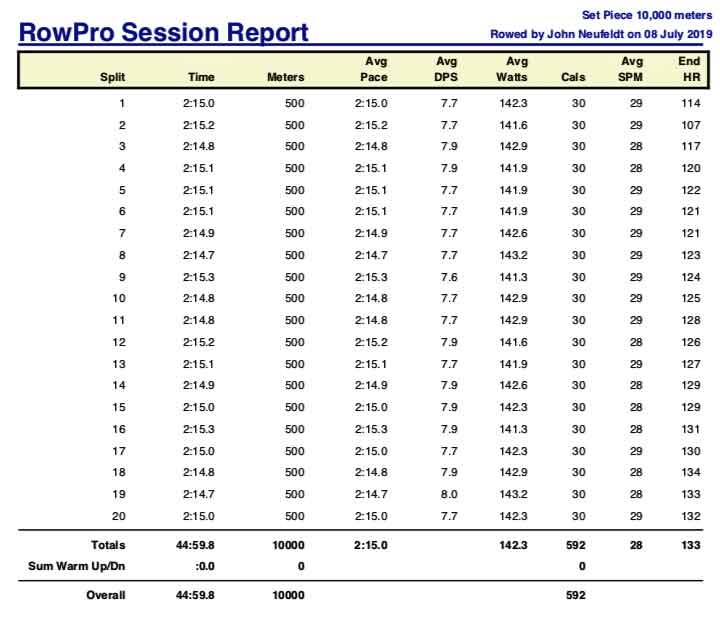
Today’s rowing workout was a 10K done at the same constant average pace as the 10K done on July 2nd. In fact, the screen recording of the July 2nd 10K was playing on a separate monitor and we both started at the same time (see photo at the top of this blog entry).
There was also a SkiErg workout done today: 171 Calories at a constant average pace of 2:31/500 meters.


Happy rowing to you!
