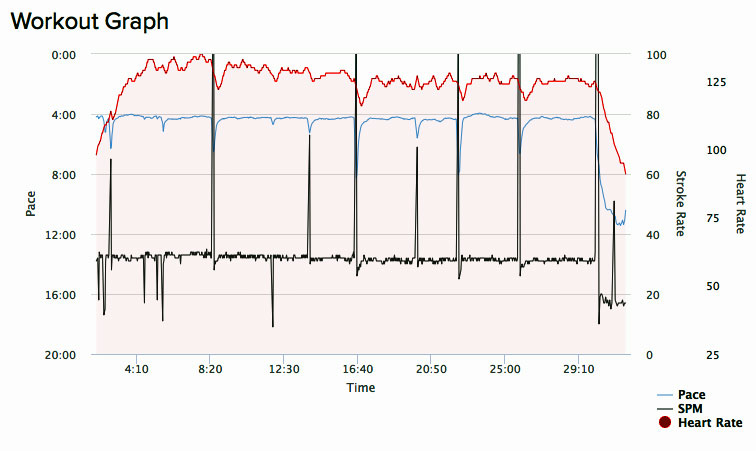
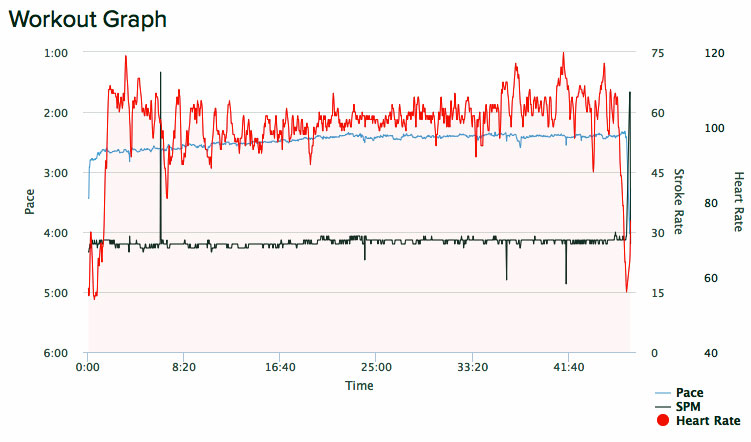
Today’s title is referring to the blog post of May 17th, “Stairway to Heaven.” The HR graph today was a lot more confused than yesterday’s and a bit more confused than on the 17th.
I had to back way off from the planned effort level and as a result had a lot slower average pace than either of the previous two days.
Other than that, everything was wonderful.
If you’d like to either view or row along with the screen recording of today’s session it is available at this link: May 19th, 2021 online rowing session.
Data for any workout sessions for any day can be seen in detail via this: link to the online logbook. To see a session’s data and interactive graph click the “+” sign in “Action” column for that session.
Data for any workout sessions for any day can be seen in detail via this: link to the online logbook. To see a session’s data and interactive graph click the “+” sign in “Action” column for that session.
The title is from some thoughts while watching the HR graph climb.
“…‘Cause you know sometimes words have two meanings.”
When HR reached 193 and time remaining decremented to 53 seconds, a songbird seemed to sing that I’d climbed high enough so I started back down the stairway.
Data for any workout sessions for any day can be seen in detail via this: link to the online logbook. To see a session’s data and interactive graph click the “+” sign in “Action” column for that session.
Today’s main workout was 30 minutes rowing online without any other virtual company.
But I was not alone.
While rowing alone you can watch a video or listen to music. I’ve done plenty of those.
Today I became and remained aware of the fact that God loves me. That’s a lot to think about: Endless forests of thoughts, countless streams of thought flowing into an infinite ocean.
God loves you. Think about it.
If you would like to view or row along, a screen recording of today’s session is available at this link: Today’s online rowing session.
Data for any workout sessions for any day can be seen in detail via this: link to the online logbook. To see a session’s data and interactive graph click the “+” sign in “Action” column for that session.
It’s been a while because I haven’t felt like writing. But as mentioned in the most recent previous post, I’ve continued rowing. Not every day. Almost every day.
Lately I’ve been doing online rowing almost daily. I’ve discovered it helps to motivate. By scheduling rowing as soon as possible each day it gets done early and then there’s a bit more of that little feeling of accomplishment.
Therefore, I either schedule an early morning rowing session or join one that someone else has scheduled.
Today’s online rowing session had been scheduled by someone else. It was especially fun simply because quite a few others turned out for it.
Today’s title is what it is, because after today’s session was complete one of the others said “John you’re a machine!” I guess that was sort of a joke because I finished first though I had rowed at the slowest pace. The reason I finished first is because the others made periodic stops for rest as part of their particular training, but I wasn’t doing their training program so I just kept rowing all the time.
So it was a bit like that fabled race between the tortoise and the hare. I was the tortoise and everyone else was a hare.
If you would like to view or row-along with it, a screen recording of today’s online session is available at this link: Click Here
Any workout sessions for any day can be seen in detail via this: link to the online logbook. To see a session’s data and interactive graph click the “+” sign in “Action” column for that session.
Though I keep hitting the Escape Key, I’m still here.
Any workout sessions for any day can be seen in detail via this: link to the online logbook. To see a session’s data and interactive graph click the “+” sign in “Action” column for that session.
Beauty is as near as the blush of early dawn light before the sun makes its appearance.
Today my rowing inspiration was from one of my training partners who recently made her workout graphs much more interesting by using a heart strap to add heart rate to her charts.
Compared to my heart rate graphs recently, hers are beautiful smooth lines. You can see one of her beautiful HR graphs immediately below this paragraph.
Notice how smooth is the graph of her heart rate. It mainly varies and makes dips only when her pace briefly dips while she slows for sips of cocoa (that is my surmise).
After gazing at her heart graph for a bit and admiring its smooth line I decided to make this morning’s rowing an emulation of sorts, to try to plot a smooth HR graph of my own. To do that I maintained a steady pace with only small adjustments for the sake of keeping HR in the vicinity of just over 100 BPM. You can see the raggedy, jagged and non-beautiful heart rate graph that resulted for my workout chart, immediately below this paragraph.
Notice how very smooth is the blue line graphing pace for my session today. My pace line looks even smoother than that of my training partner, because I did not make any pauses with their resulting dips. Heart rate seemed like it was ready to gallop, though, if I would just give it sufficient excuse, so I had to continually make incremental pace adjustments in reaction to heart rate suddenly starting to climb or plunge.
Any workout sessions for any day can be seen in detail via this: link to the online logbook. To see a session’s data and interactive graph click the “+” sign in “Action” column for that session.
If my heart was engaged in quantum entanglement today, the other heart was behaving coherently most of the time.
After yesterday’s consistently incoherent inconsistency of heart rate relative to effort level, I expected more of the same today. But it was as if I’d had a change of heart, because for most of the time heart rate did what it would be normally expected to do. It’s rate rose when effort level increased and vice versa. A pleasant surprise.
The workout time today was divided into 4 pieces. The morning started with 3 rowing sessions: 4,515 meters, 7,000 meters and a 70 Calorie, 1,316 meter piece. In the afternoon was a single 390 Calorie session on SkiErg.
4,515 Meters rowing.
7,000 meters rowing.
Seventy Calories rowing.
Afternoon session: 390 Calories on SkiErg
Any workout sessions for any day can be seen in detail via this: link to the online logbook. To see a session’s data and interactive graph click the “+” sign in “Action” column for that session.
Other titles that came to mind for today’s blog post were “Inappropriate Relationships” and “Constantly Inconstant.” All of the title choices are in reference to how the heart behaved today as its rate didn’t necessarily make any sensible relationship to the effort level.
Morning activity was two rowing sessions and afternoon activity was one session on the SkiErg.
Graph for the morning rowing session. Heart rate is the red line and effort level is the blue line.
Second rowing session in the morning- a 70 Calorie piece at constant easy pace.
Afternoon SkiErg session done at a fairly constant and moderate pace.
Any workout sessions for any day can be seen in detail via this: link to the online logbook. To see a session’s data and interactive graph click the “+” sign in “Action” column for that session.
The cozy fire in a fireplace is a common example of oxidation to produce heat. There is an oxidative system in the human body which also produces heat, though without any colorful flames. That oxidative system is put into action during warmup activity and other gentle movement of the muscles.
Today’s workout time consisted of rowing in the morning and SkiErg in the afternoon. You can see on the graphs that heart rate was a bit whacky/abnormal until 10 or 20 minutes was spent warming up for the sessions.
Chart for the first session, which was 11,500 meters.
Chart for the second morning session, which was 60 Calories at easy pace.
Chart for the first of two afternoon SkiErg sessions.
Chart for the second of two afternoon SkiErg sessions.
Any workout sessions for any day can be seen in detail via this: link to the online logbook. To see a session’s data and interactive graph click the “+” sign in “Action” column for that session.