
Heart rate has been steady and without any arrhythmia since yesterday’s rowing session “cured” that problem. With today’s rowing, I wanted to keep it that way, but still get a good workout.
Today’s rowing goals were to (1) keep the distance to no more than 10,000 meters, (2) use the first part of the session to gradually warm up, (3) gradually reach for and arrive at the effort level that would raise heart rate to 158 BPM, (4) continue at whatever effort level was needed to maintain about 158 BPM until the remaining distance counted down to 2,000 meters remaining and then (5) gradually reduce the effort level using the last 2,000 meters as a tapered warm down.

The term “sweet spot” is used in baseball to refer to the optimal place on the bat with which to make contact with the baseball. In today’s rowing session, the optimal heart rate or “sweet spot” goal was 158 BPM because that is the highest rate that is still within the two lowest aerobic heart rate zones calculated for me, relative to my presumed “lactate threshold heart rate”. I won’t try to explain it in any detail but you can do what I did and look it up if you want to learn about it. I used information supplied in the book, “80/20 Running,” by Matt Fitzgerald, to calculate the heart rate zones shown in the image below.
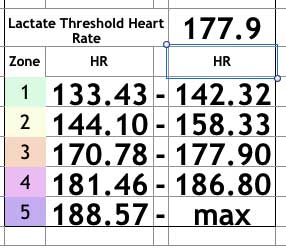
It’s been a while since I’ve calculated my “lactate threshold heart rate” zones, so the above chart might not be exactly right, but those are the results from the most recent time they were calculated.
Zones 1 and 2 are the optimal ranges to sustain when doing aerobic exercise, so as to sufficiently work the body and heart without overdoing it. Zones 3 and above are to be avoided most of the time except when racing.
Those zones will be different and unique for each individual and will change, depending on a person’s activity levels and time spent working out. So… one of these days I should re-calculate those zones but in order to do that I have to race for 30 minutes and use the average heart rate for the last 10 minutes as the Lactate Threshold Heart Rate, which is the reference point for calculating all 5 ranges.
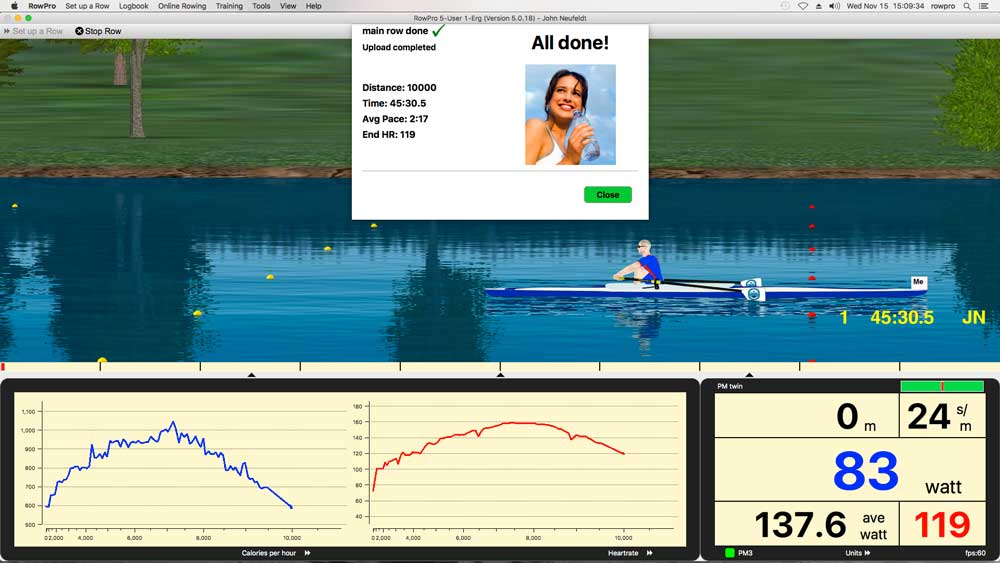
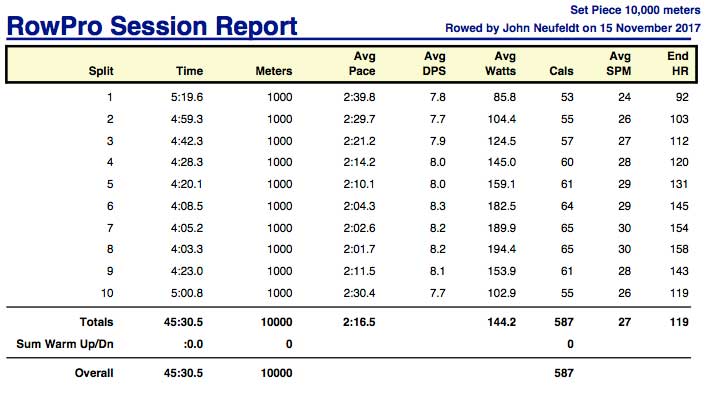
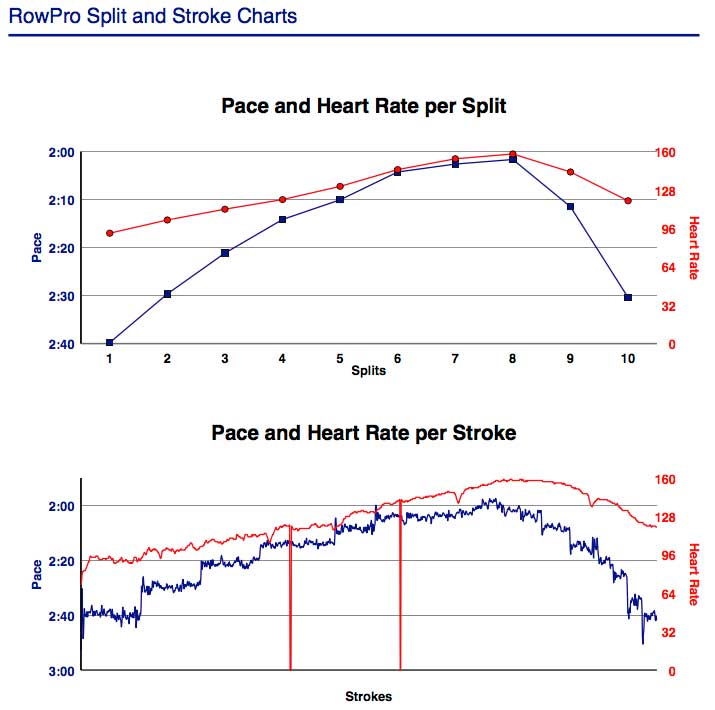
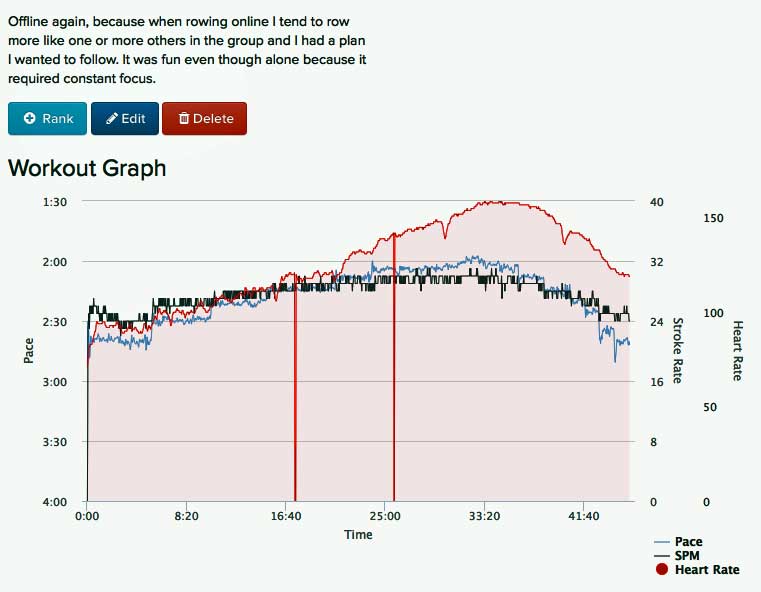
Below are the screen shots relating to today’s indoor rowing:
Happy rowing and steady heart rate to you.